Every year, even when the ACA is running smoothly, there are always changes in market participation, as different insurance carriers enter or exit the individual market in certain states or either expand or shrink what parts of the state they offer healthcare policies in.
2026 is no exception, and given the massive turmoil the ACA exchanges are undergoing right now (due primarily to the expiring federal tax credits as well as regulatory changes made by the Trump Regime's so-called "Integrity & Affordability Rule"), there's either 13 or 32 insurance carriers throwing in the towel in one or more states, depending on how you count a carrier operating in multiple states or under multiple subsidiary brandings.
It's important to keep in mind that the following list probably isn't comprehensive--it includes the carriers which I've confirmed are pulling out statewide (with one exception: Meridian Health Plan of Michigan is only pulling out of parts of the state). There's likely one or two that I've missed, especially given that several of these have only made their final decisions within the past week or so.
(Aetna/CVS is pulling out of the ACA individual market in every state; I've made an educated guess as to their current enrollees, who aren't counted as part of the weighted average as they'll have to shop around for a new carrier this fall. See below.)
Antidote Health Plan:
(Antidote's actuarial memo is heavily redacted so I don't know their current enrollment; I've had to make an educated guess. See below.)
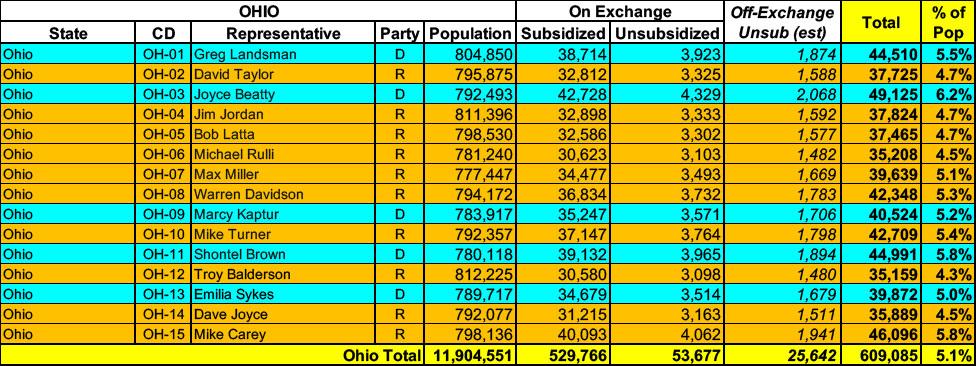
With the pending dire threat to several of these programs (primarily Medicaid & the ACA) from the House Republican Budget Proposal which recently passed, I'm going a step further and am generating pie charts which visualize just how much of every Congressional District's total population is at risk of losing healthcare coverage.
USE THE DROP-DOWN MENU ABOVE TO FIND YOUR STATE & DISTRICT.
Ohio has around ~583,000 residents enrolled in ACA exchange plans, 91% of whom are currently subsidized. I estimate they also have another ~25,000 unsubsidized off-exchange enrollees.
As a result, I've been able to put together a weighted average requested rate increase for the individual market, which comes in at +3.9%.
For the small group market, I have to go with an unweighted average of +12.0%. It's also worth noting that it looks like one of Aetna's divisions is pulling out of the OH small group market, as are two fof the 4 (!) UnitedHealthcare divisions and possibly AultCare, although I'm not sure about that one.
As a result, I've been able to put together a weighted average requested rate increase for the individual market (I estimated the one missing enrollment number based on the overall Ohio indy market total); it comes in at 7.6%.
For the small group market, I have to go with an unweighted average of +10.8%. It's also worth noting that, once again, Humana appears to be bailing on the entire small group market nationally from what I can tell.
UPDATE 10/31/23: The Ohio Insurance Dept. has posted a summary of the weighted average rate increase for the individual market as being slightly higher than the preliminary requests (+7.8% vs. 7.6%):
Premiums for 2024 are projected to increase compared to 2023 - though individual companies' rates will vary from the average.
Weighted average annual premiums for the individual market for 2024 are projected to be $7,010.20. In 2023 weighted average annual premiums were $6,500.65. - an increase of 7.84%.
The final/approved rates are also now posted at the federal Rate Review website...and they've barely changed at all. Yet the official weighted average is slightly higher than I had estimated earlier.
The same is true of the small group market...only 2 carriers (Medical Mutual and Paramount) had their requested changes modified, and even then it was only by a hair apiece.
Over on Twitter, political commentator Krystal Ball made an interesting claim:
A provision in Obamacare allows residents in areas deemed a public health disaster to be covered by Medicare for life. At the very least, East Palestine residents deserve this universal coverage after being exposed to a known carcinogen. https://t.co/ooPYmJ4Y8b
An estimated additional 34,000 people are now eligible for essential care for a full year after pregnancy, thanks to the American Rescue Plan and the Biden-Harris Administration’s efforts to strengthen maternal health coverage.
Today, the U.S. Department of Health and Human Services (HHS), through the Centers for Medicare & Medicaid Services (CMS), approved the extension of Medicaid and Children’s Health Insurance Program (CHIP) coverage for 12 months after pregnancy in Hawaii, Maryland, and Ohio. As a result, up to an additional 34,000 people annually – including 2,000 in Hawaii; 11,000 in Maryland; and 21,000 in Ohio – will now be eligible for Medicaid or Title XXI-funded Medicaid expansion CHIP coverage for a full year after pregnancy. With today’s approval, in combination with previously approved state extensions, an estimated 318,000 Americans annually in 21 states and D.C. are eligible for 12 months of postpartum coverage. If all states adopted this option, as many as 720,000 people across the United States annually would be guaranteed Medicaid and CHIP coverage for 12 months after pregnancy.
For the small group market I don't think they even do that; I have to rely on the federal Rate Review site, which almost never provides enrollment data.
Fortunately, for the indy market at least, all of the requested rate filings are available via the SERFF database, along with enrollment figures for 9 of the 10 carriers in the market. For the tenth (AuitCare), I used an estimate based on last years' hard number. Unfortunately, I still don't know the approved rates for any of them, but it looks like the state regulators chopped them down somwhat, since the weighted average comes in at 4.8% vs. the requested 8.4% statewide.