Medicare Advantage (technically "Medicare Part C" & originally called "Medicare+Choice") is a type of health plan in the United States offered by private companies as part of the original Social Security Act of 1965 that created Medicare. It permits a private insurance option that wraps around traditional Medicare. Medicare Advantage plans attempt to fill some coverage gaps and offer alternative coverage options.
Under Part C, Medicare pays a plan operator a fixed payment for each enrollee. The operator then pays for their medical expenses. Traditional Medicare directly compensates providers on a fee-for-service basis. Plans are offered by integrated health delivery systems, labor unions, non profit charities, and health insurance companies, which may limit enrollment to specific groups of people (such as union members).
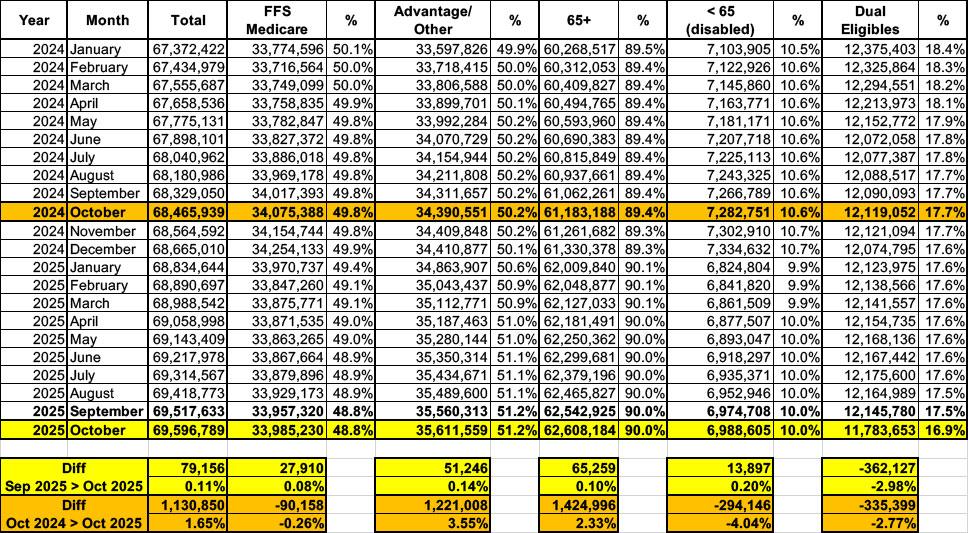
Whether the data posted since January 20, 2025 is accurate or not, I can't say for certain, but at least they're updating it...and so far, at least, I don't see anything in their monthly reports which is setting off any obvious red flags.
In any event, according to the latest report, as of November 2025:


