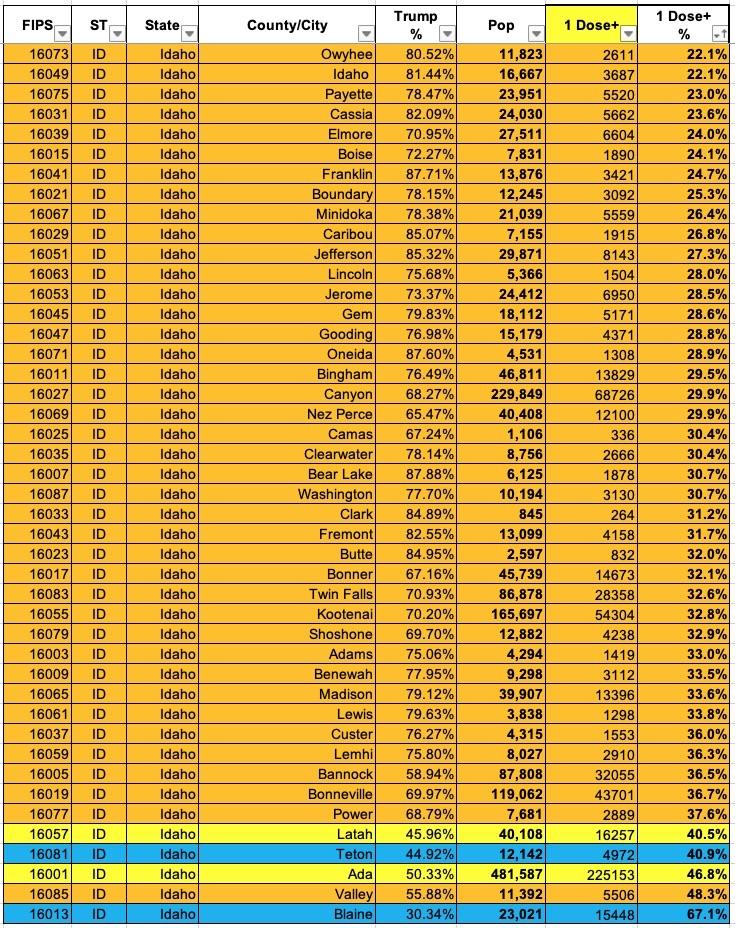
Now that I've developed a standardized format/layout & methodology for tracking both state- and county-level COVID vaccination levels by partisan lean (which can also be easily applied to other variables like education level, median income, population density, ethnicity, etc), I've started moving beyond my home state of Michigan.
The ACA's language didn't account for the possibility that some states might not expand Medicaid, which is why the lower-end range of exchange plan subsidy eligibility starts off at 100% FPL...
Unfortunately, those earning less than 100% FPL are still stuck without any viable options besides either "going bare" and praying they don't get sick or injured or possibly buying a junk plan of some sort. According to the Kaiser Family Foundation, there's around 2.2 million Americans still caught in the "Medicaid Gap", where they don't qualify for Medicaid but don't earn enough to be eligible for subsidized ACA exchange policies (Kaiser estimates another 1.8 million uninsured adults in these states in the 100 - 138% "overlap" cateogory, plus around 356,000 who are eligible for Medicaid but still haven't enrolled for one reason or another).
NOTE: This is an updated version of a post from a couple of months ago. Since then, there's been a MASSIVELY important development: The passage of the American Rescue Plan, which includes a dramatic upgrade in ACA subsidies for not only the millions of people already receiving them, but for millions more who didn't previously qualify for financial assistance.
Much has been written by myself and others (especially the Kaiser Family Foundation) about the fact that millions of uninsured Americans are eligible for ZERO PREMIUM Bronze ACA healthcare policies.
I say "Zero Premium" instead of "Free" because there's still deductibles and co-pays involved, although all ACA plans also include a long list of free preventative services from physicals and blood screenings to mammograms and immunizations with no deductible or co-pay involved.
If you have a fairly healthy year, you really could go the entire year without paying a dime in healthcare costs while still taking advantage of many of these free services, and also having the peace of mind that in a worst-case scenario, at least you wouldn't go bankrupt. Not perfect, but a lot better than going bare especially since you wouldn't pay a dime in premiums.
The Centers for Medicare & Medicaid Services (CMS) announced today that efforts are underway to support Texas in response to severe winter storms that have affected the state over the past several days. On February 17, 2021, Health and Human Services Acting Secretary Norris Cochran declared a public health emergency (PHE) for Texas retroactive to February 11, 2021. CMS is working to ensure hospitals and other facilities can continue operations and provide access to care despite the effects of the storm.
Below are key administrative actions CMS is taking in response to the PHE declared in Texas:
Waivers and Flexibilities for Hospitals and other Healthcare Facilities: CMS has already waived many Medicare, Medicaid and CHIP requirements for facilities because of the pandemic.
Now I have most of the data needed to analyze the individual market for 2021: Assuming no major changes in the approved rates, carriers are averaging around a 7.4% premium increase next year. This is actually unusually high for 2021 so far...other states are averaging less than 2% overall.
Most of the rate hike seems to be caused by Celtic/Ambetter ("Superior Health Plan"), which holds 1/3 of the entire market and is raising rates by nearly 12%. Blue Cross Blue Shield, which has another 36% market share, is only raising rates 3%, while the third and fourth largest carriers in the market, Molina and Oscar, are raising rates by 5.3% and 14.7% respectively.
There's also a couple of misleading numbers--both divisions of "Scott & White" are massively DROPPING their premiums for 2021, by 33% and 54%...but they have fewer than 2,000 people enrolled total to begin with; make of that what you will.
Unfortunately, it looks like only some of the 2021 ACA individual market premium rate filings have been uploaded to the SERFF database as of today, so I'm unable to calculate anything even close to an accurate weighted average. There are, however, several noteworthy items on the TX market:
Note: I've been distracted by my county-level COVID19 tracking project for the past couple of weeks, so I'm posting a series of entries on various ACA/healthcare policy developments which I've missed along the way.
Sen. John Cornyn (R-Texas) sat down for an interview yesterday with PBS Austin's Judy Maggio, who raised concerns about "holes in the safety nets" affecting many Texans. Specifically, the host noted that as more people lose their jobs during the pandemic, they're also losing their health security. Maggio asked the Senate Republican about possible federal efforts for those who are now "wondering what they're going to do for health insurance."
Minnesota was an obvious choice, given that it was the closest swing state won by Donald Trump. Texas may seem like an unusual choice given that it's considered to be a solid red state and that it hasn't seen the type of ugly outbreak of COVID-19 (yet) that several other states have, but I happened to discover that unlike states like Florida and Georgia, Texas's Health Dept. dashboard makes it quite easy to download the historic case and fatality data I need to compile these charts, so I decided to go for it. The results in both states are interesting for different reasons.
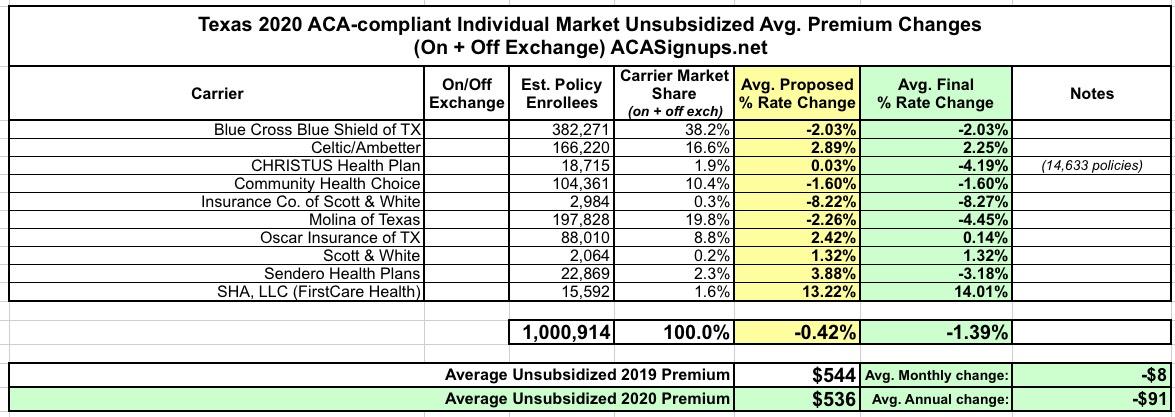
Back in mid-August, I plugged in the preliminary 2020 individual market rate change requests for unsubsidized enrollees in Texas. Unfortunately, at the time I only had hard enrollment data for some of the carriers, which meant I could only run a "semi-weighted" statewide average, which came in at +0.8%.
Since then, I've managed to find the enrollment data for the rest of the carriers as well...and yesterday CMS posted the final, approved 2020 rate changes, allowing me to run the complete, final, fully-weighted average. In the end rates in Texas are dropping by 1.4%:


